-
Products
Services
Tools
Industry Specific
-
Solutions
By Business Type
By Business Function
By Industry
- Support
- Login
- Try it for free
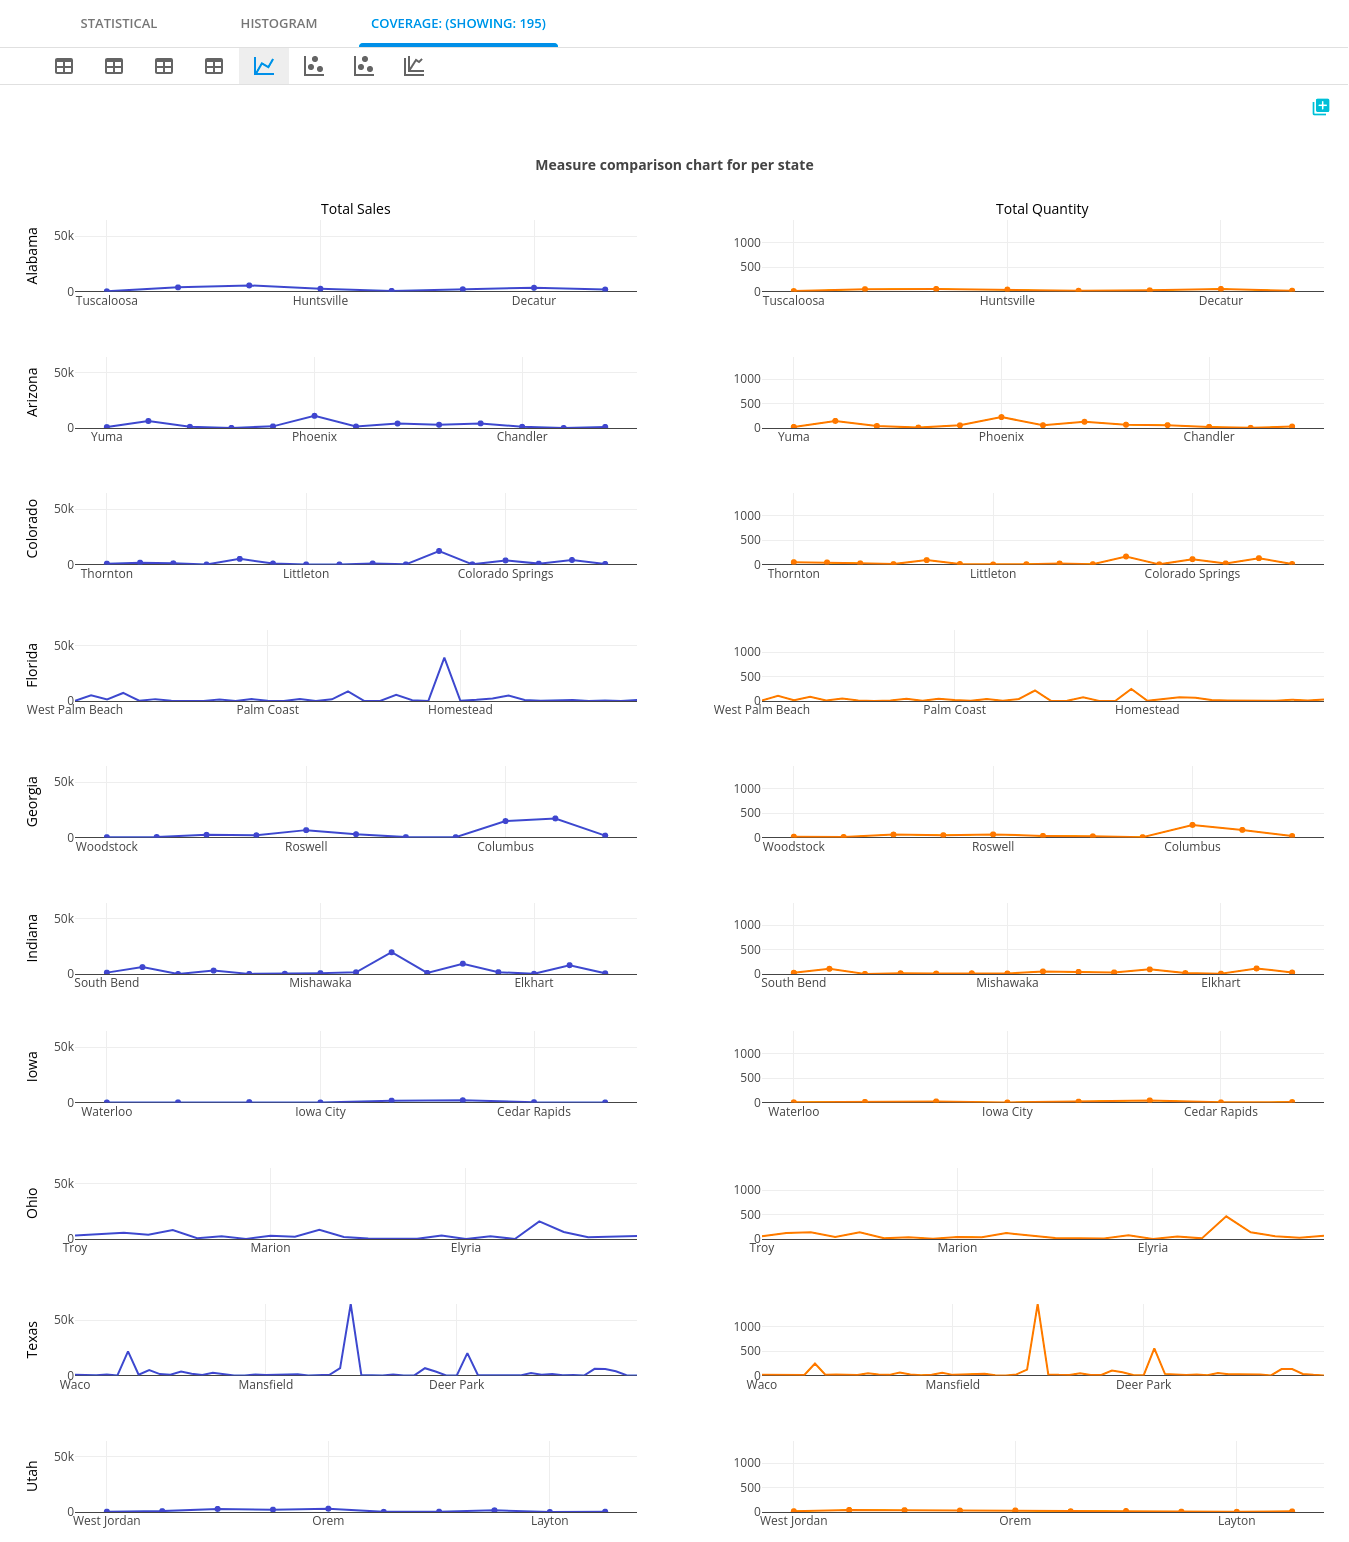
If more than one measure is selected this sub plot will be displayed. Subplot will be plotted for each measure and each attribute belonging to that measure. Each line chart shows the trends for measure vs attribute data.
This chart option is visible only if