-
Products
Services
Tools
Industry Specific
-
Solutions
By Business Type
By Business Function
By Industry
- Support
- Login
- Try it for free
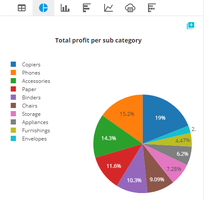
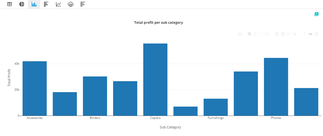
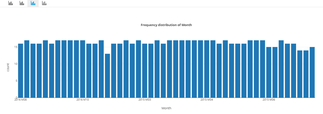
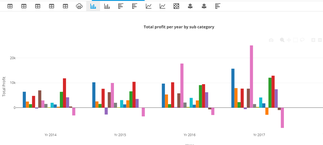
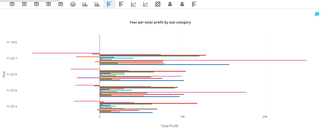
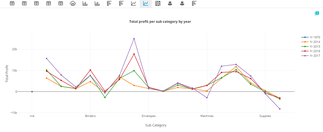
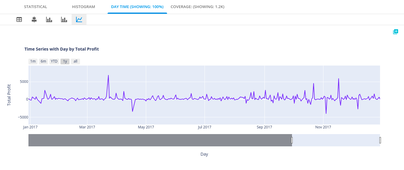
Graphical representation of any business data or information is Data Visualization. To understand the data better, BizStats.AI provides different perspectives of graphs, charts, data charts, and geo charts. This will help to understand better about trends in time series data, outliers of categorical data, and patterns of historical data.
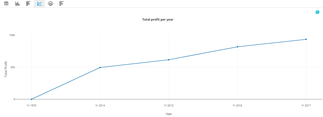
To analyze massive amounts of data, better visualization plays vital roles to make data-driven decisions faster. Considering this BizStats.AI automatically suggest insights with appropriate charts based on the patterns in the data.
As a search based data analytics tool, BizStats.AI, our motto is “Analytics by search” to provide the best possible analysis for any business related query using the connected data sources.
Any query asked by the user will be answered with multiple sections of analysis reports.
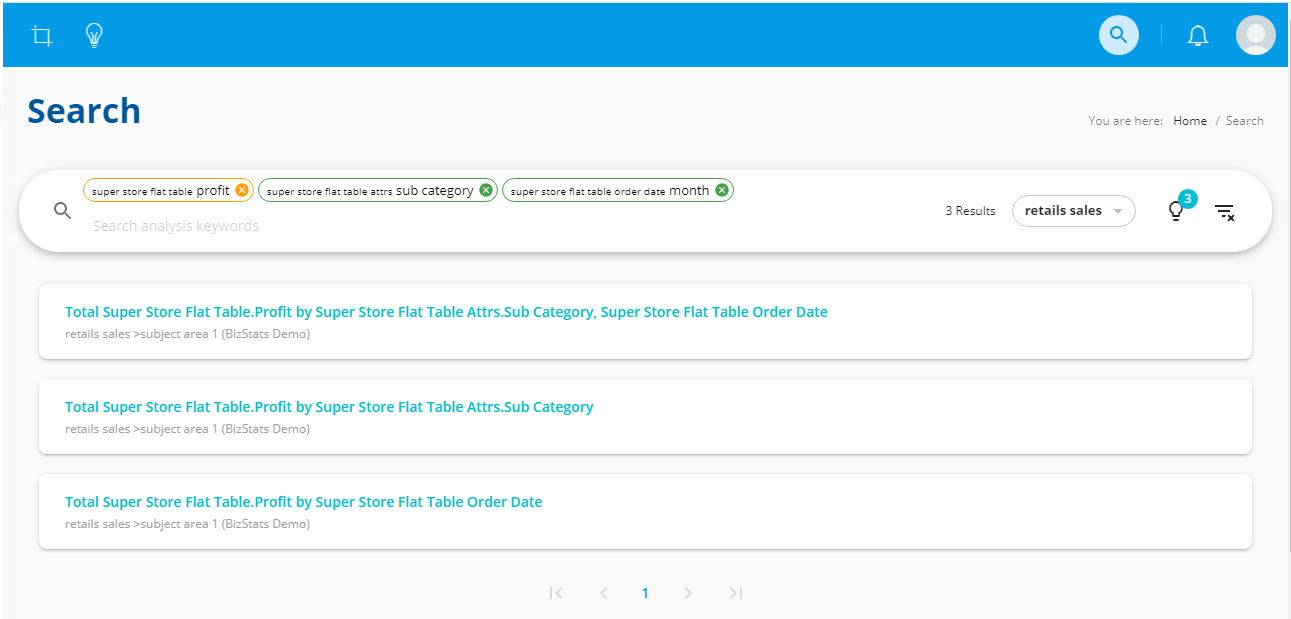
Each section with a unique combination of data elements like
For each combination, BizStarts.AI will provide possible analysis options as follows
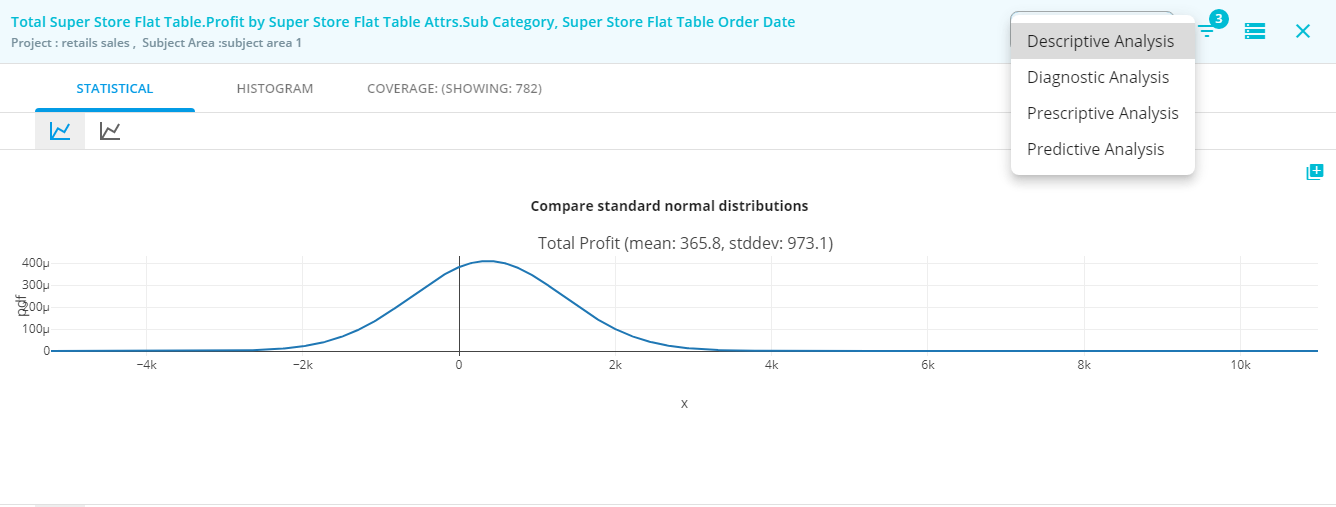
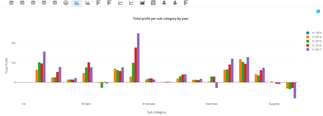
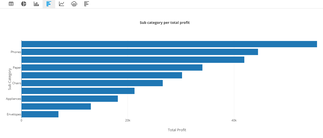
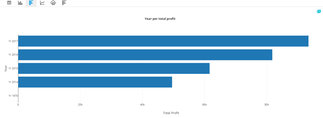
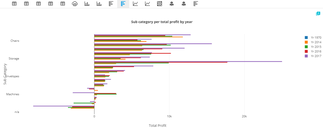
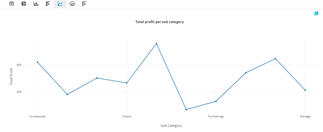
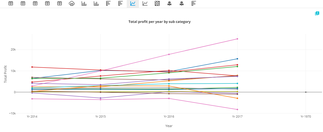
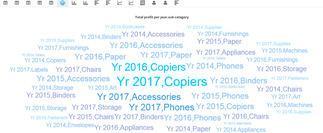
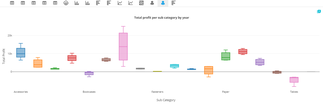
In this, each analysis option has many data visualization element like graphs, charts and pivot data table which will be most relevant to those data elements in the section. These different perspectives of the data element may help us to uncover hidden treasures.
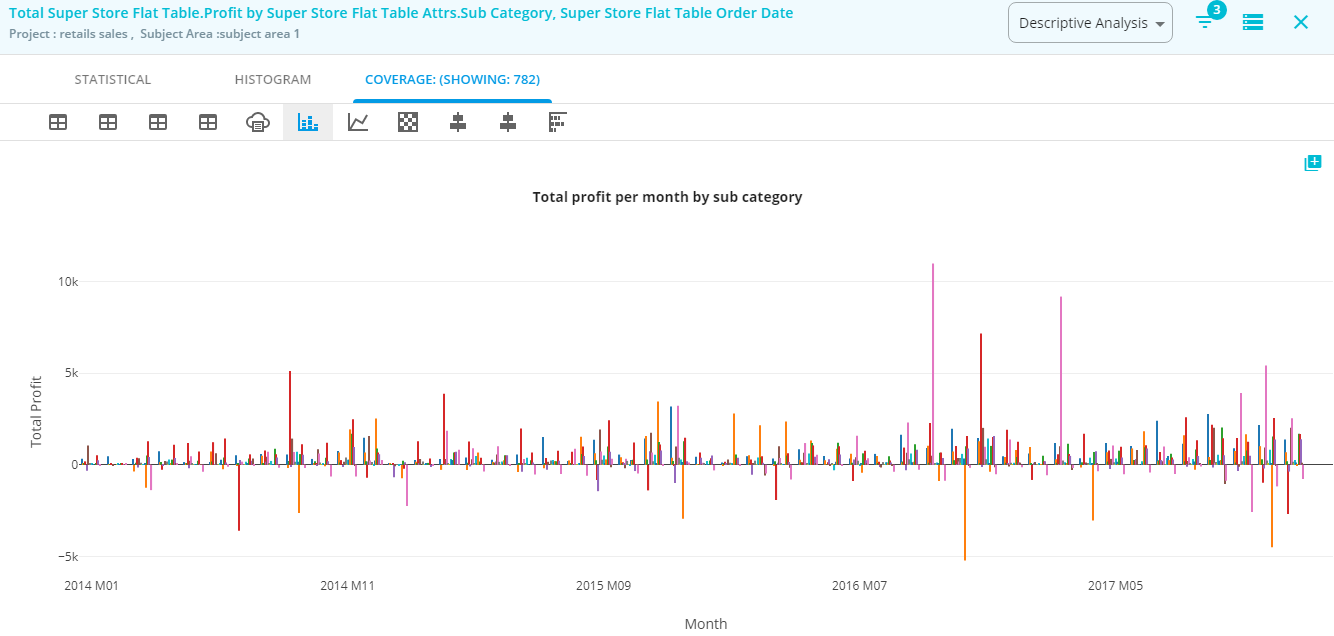
BizStats.AI provides a huge number of perspectives options for each analysis and each perspective may give various insights.