-
Products
Services
Tools
Industry Specific
-
Solutions
By Business Type
By Business Function
By Industry
- Support
- Login
- Try it for free
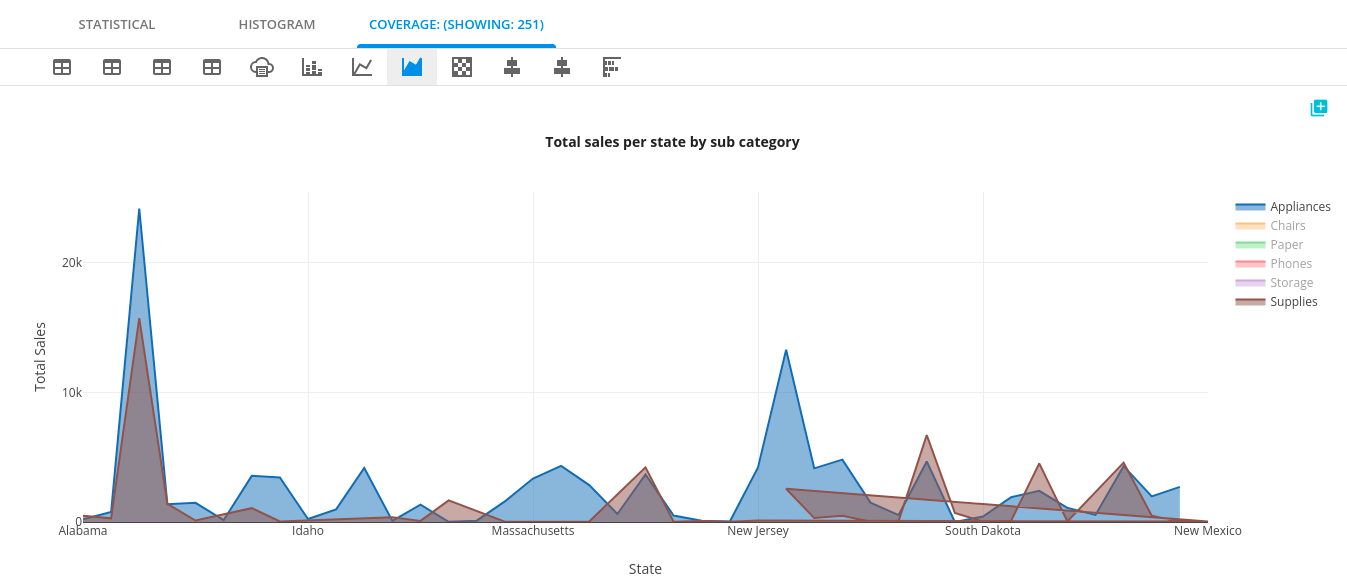
In the stacked area chart, lines are plotted one at a time, with the height of the most recently-plotted group serving as a moving baseline. As such, the fully-stacked height of the topmost line will correspond to the total when summing across all groups.
This chart option is visible only if