-
Products
Services
Tools
Industry Specific
-
Solutions
By Business Type
By Business Function
By Industry
- Support
- Login
- Try it for free
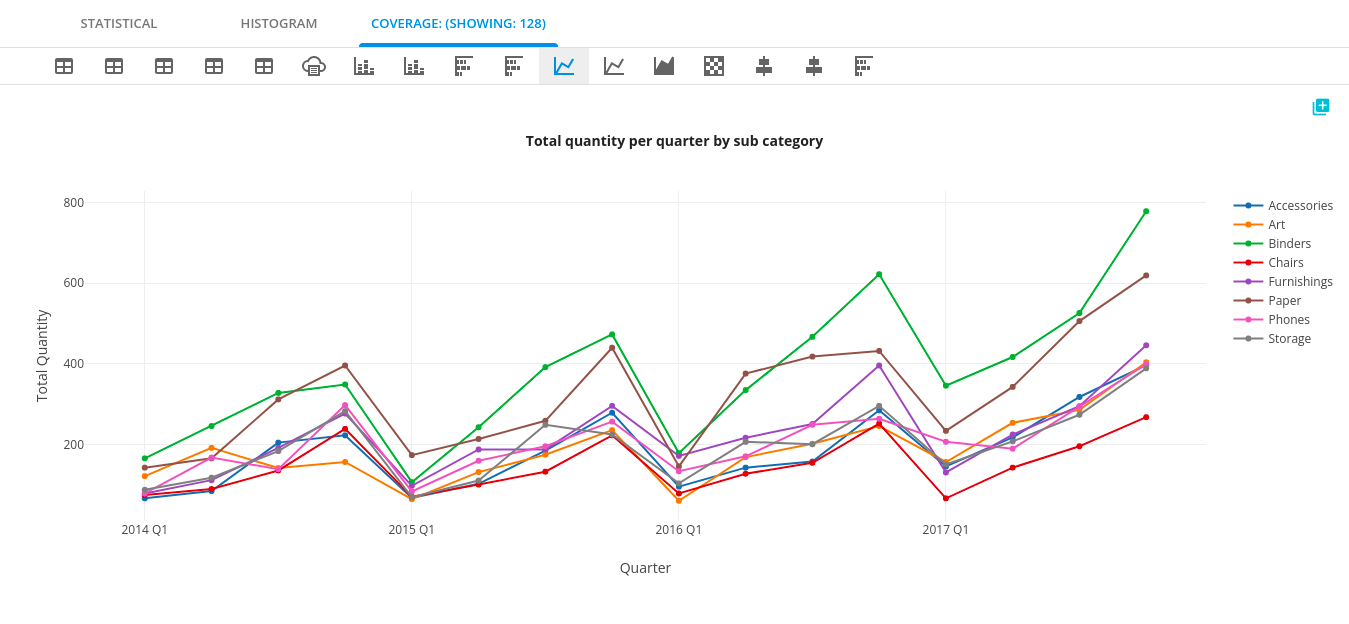
The multi-series line chart is used to visualize trends and relationships in multiple datasets. It consists of various data points connected using line segments, where each point represents a single value. It is widely used to show continuous data per quarter.
This chart option is visible only if