How DWS helps Retail Industry
One of the biggest reasons to use DWS to guide decision-making is to ensure your decisions are based on actual truth (cold, hard numbers), not just someone’s perception of reality.
DWS Analytics can also help you understand what’s going on with your business in much greater detail than you could otherwise.
Practically speaking, a retailer can use DWS data analytics to:
- Understand the value and number of products sold in an average order
- Recognise which products sell the most, the least, and everything in-between
- Identify your most valuable customers
- Discover what your true demand was as well as past lost sales
- Determine optimal suggested order quantities and recommend purchase quantities and allocations
- Establish the optimal price point for a specific product at any specific location
- These (and other) insights can equip you to better understand the metrics of your business and implement strategies that help you get to where you want to go.
As you grow, analyzing data needs to become a core part of your business to improve decision-making and come up with effective retailing strategies.
Benefits of using DWS
To effectively manage and organize your data, many businesses turn to Business Intelligence tools. Because BI tools like DWS help you structure and visualize your data, they are an example of descriptive analytics.
- DWS supports multiple data sources, appealing visualizations, and some degree of data manipulation.
- Reduce the human input and time-consumption for data analysing, data modelling & data visualization
- DWS is especially true for medium to large retailers running hundreds or thousands of stores (and tens or hundreds of thousands of products). This is why many retailers have dedicated teams of analysts in most departments to generate reports. But DWS reduces the data analyst workload.
- Automated most of the manual, repetitive tasks associated with traditional BI practices.
- Automated reporting and data visualization
- Reconcile all changes and updates across all departments and data sources
- Focus on the process and not exclusively on data itself, companies can uncover stronger insights and be in a more advantageous position to succeed when attempting to predict business and consumer needs.
Search Analytics Cases
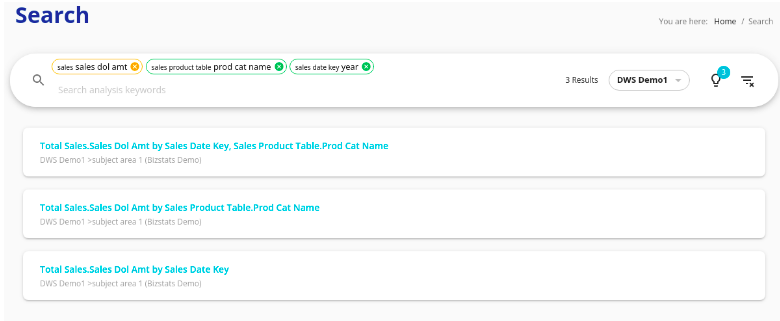
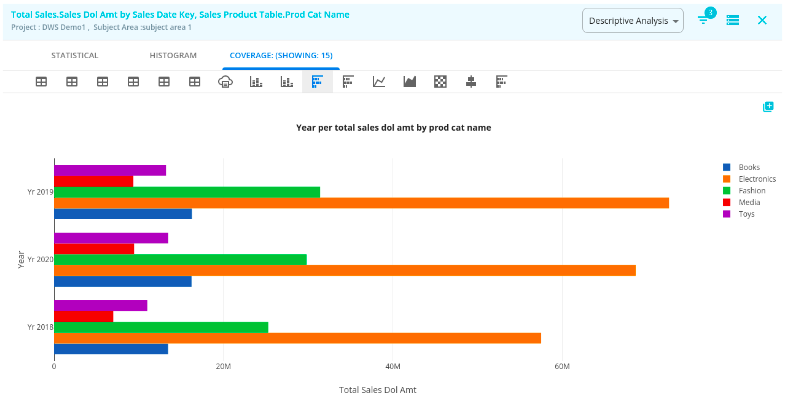
Search #1 Year wise Sales Dollar amount by product category
Step 1 : Select “Sales Dollar amount” in Facts & Product category, Year in Dimensions and click Search button
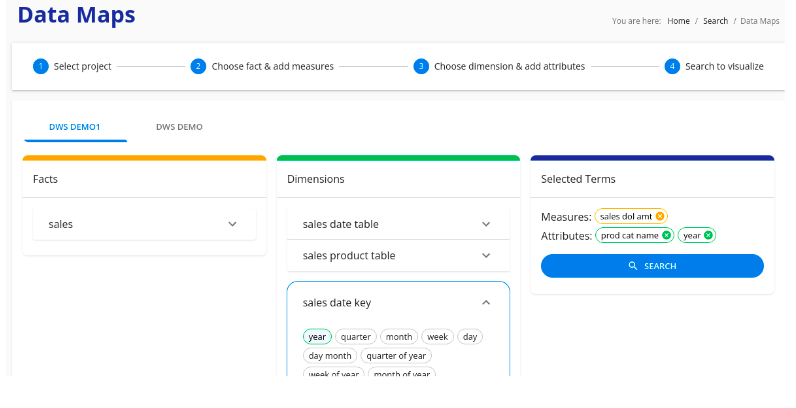
Step 2: Select relevant result section
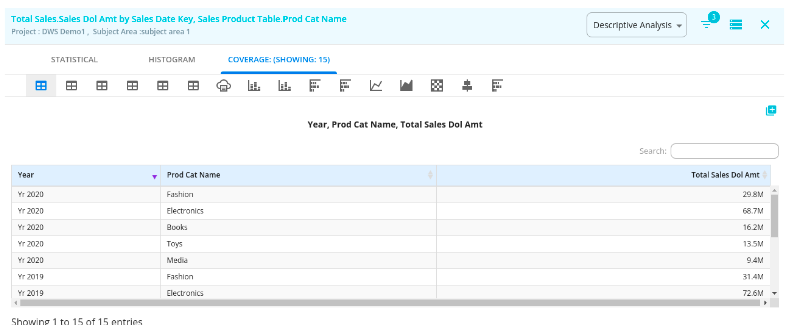
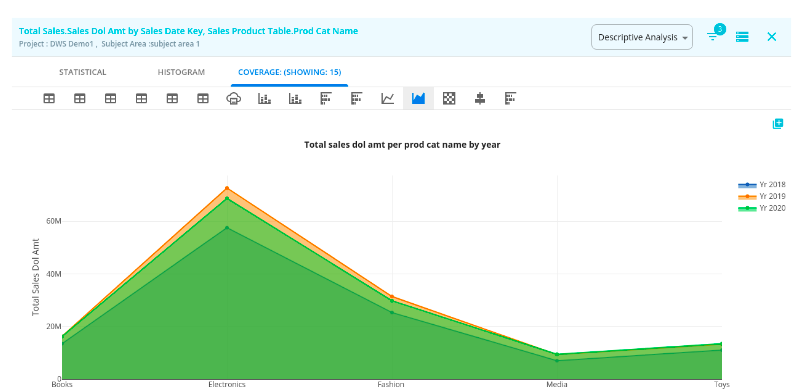
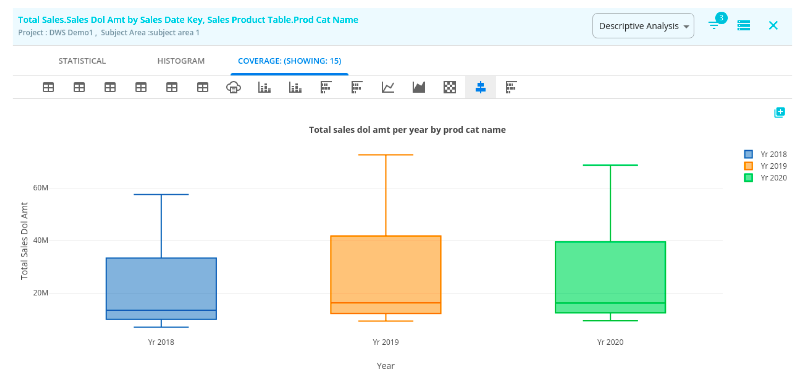
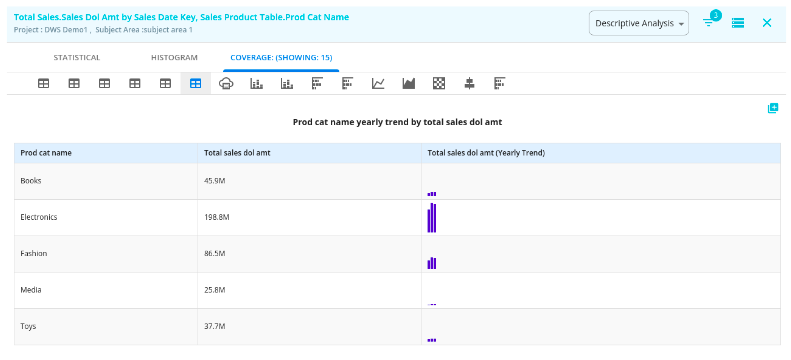
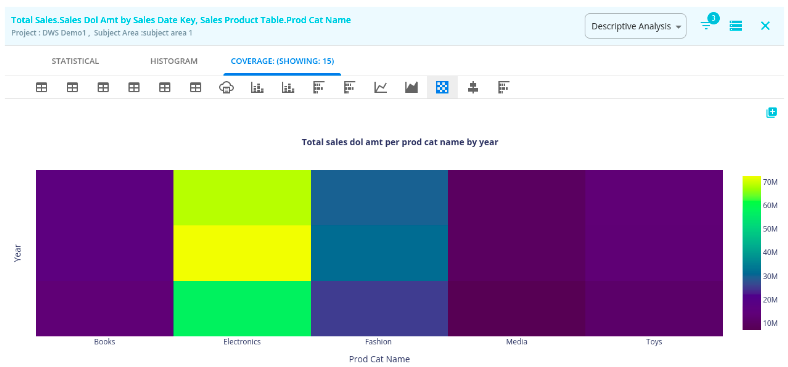
Step 3: Change different type of analytics and analyze
Advanced Filters: Click Filter icon and add more measures or attributes to your search
Also you can add filter conditions
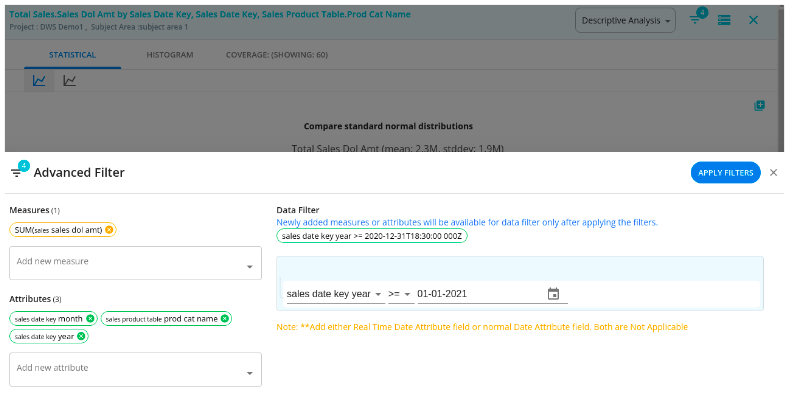
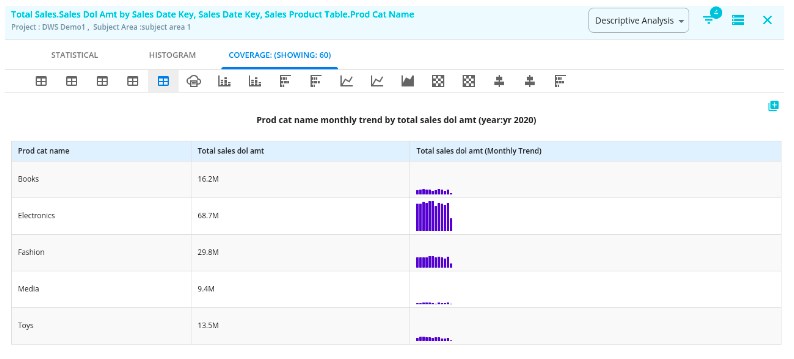
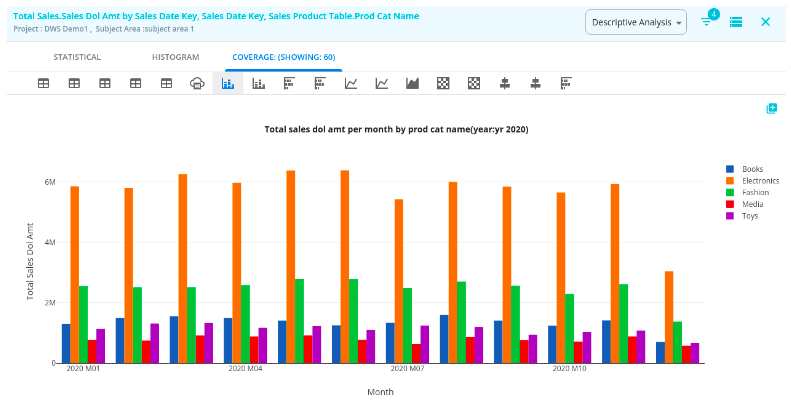
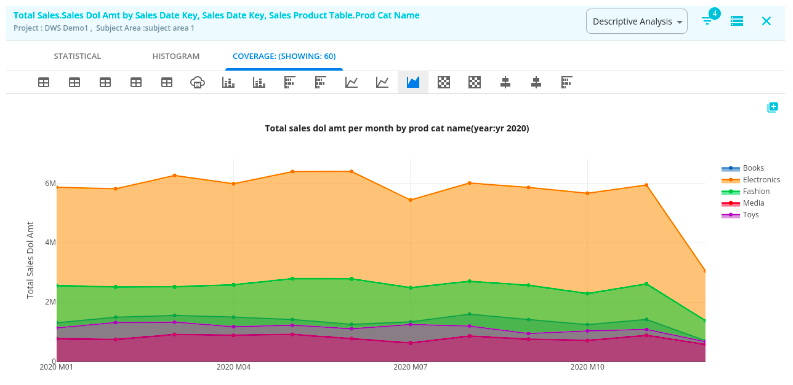
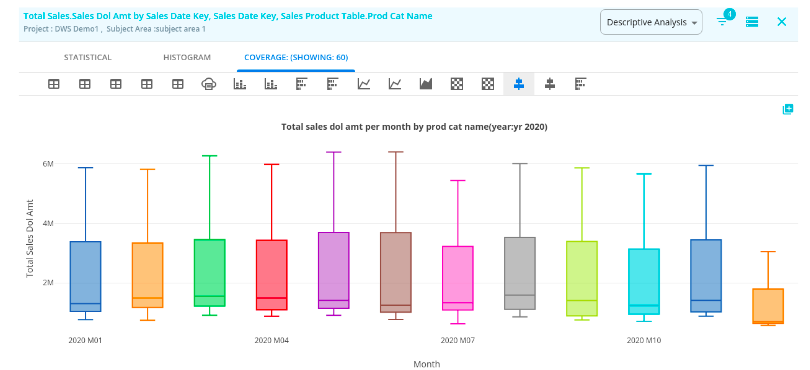
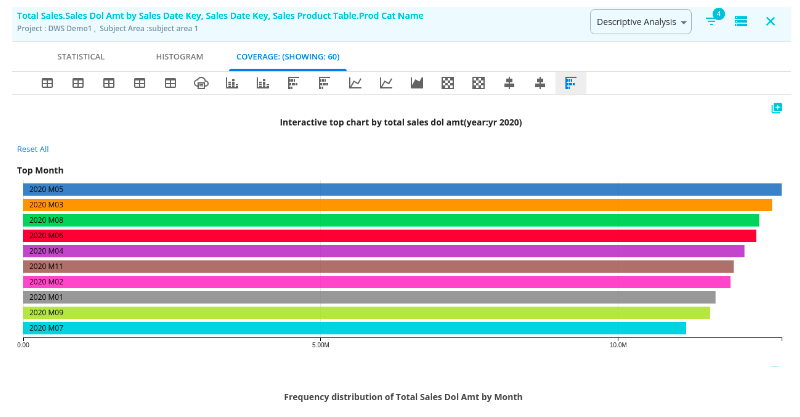
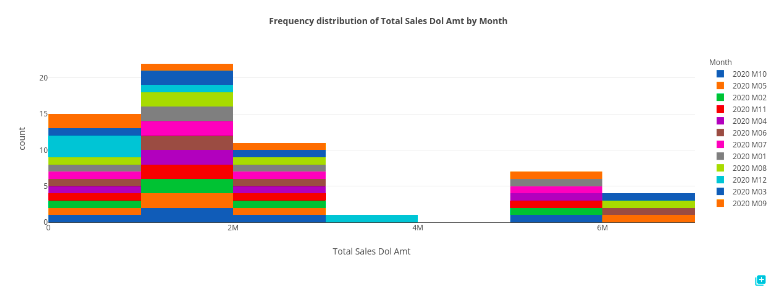
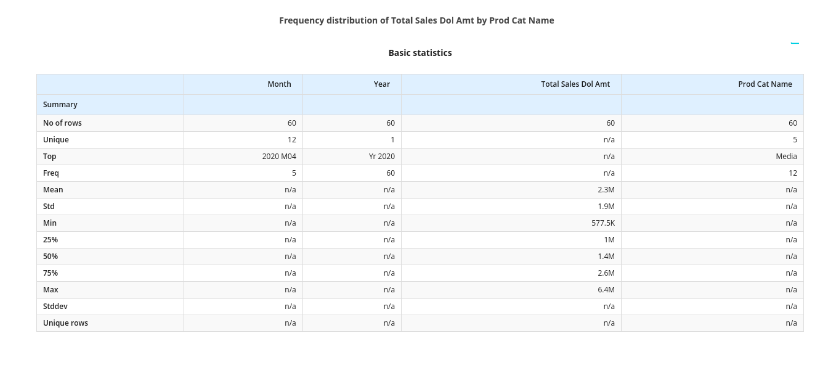
Search #2 Month wise Sales Dollar amount by product category in Year 2020