In recent years, the rapid progress of technology in mining data has made it easier for businesses to decode and formulate strategies in handling customer fluctuations. Organizations these days are focusing on tailoring their sales and marketing strategies to suit various patterns of consumption observed. Long gone are the times when a simple classic supply-demand curve worked in predicting customer count and purchasing patterns. The demand part of the curve seems to be undergoing a mammoth and complex transformation which involves various key factors including promotions, social media and even the weather. It is prudent to align business strategies to handle the various peaks and blimps in consumption. This alignment can be made possible by drilling down data to monitor various key metrics like customer count, purchasing pattern, social media leads and promotional leads. Also, this metrics can help solve various operational challenges which would eventually translate to profitability and pave way for innovation.
Customer Count
The number of customers is a perfect and crucial metric for any business, be it retail, e-commerce, service, merchandising or even manufacturing. Key sales data falls short in one aspect that, it doesn’t track a customer who shows intention to purchase but does not ultimately purchase. This applies even to the e-commerce platforms where customers simply add things to the cart but do not ultimately purchase all the items from the cart. In the retailer context, this footfall data is almost ignored as it is slightly difficult to track when compared to the e-commerce platform. Customer count is also vital from an operational viewpoint. Under staffing in peak season and over staffing in low demand season can result in serious tangible and intangible effects as far as retailers are concerned. The effect of this scenario cascades to concerns with target setting, incentive management and performance measurement. 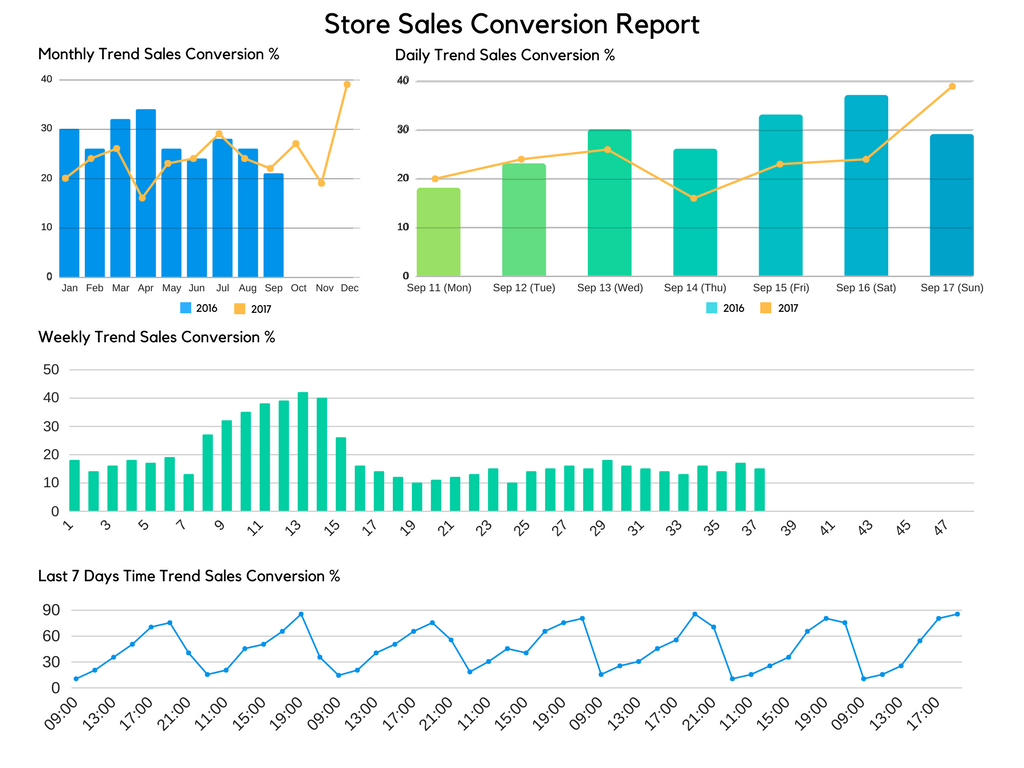
Fig 1: Store sales conversion report ( Monthly, Daily & Weekly trends)
As far as strategic planning is concerned, customer count plays a pivotal role in portfolio analysis and expansion planning. Fig 1 shows a sample report generated typically to track the footfalls conversion to sales in a day. A decrease in footfalls can be attributed to lack to promotion both in social media and physical medium. A visual prompt or a catchy advertisement is more likely to lure customers into the store when they pass by the ad every day. At the end of day, if it’s out of sight, it’s out of mind too! In this brick and click world, it is imperative to balance between cost, promotions and inventory.
Promotion drives and footfalls
Formulating a promotion strategy and picking the right mix of promotion types is the dire need of the day. Footfall is the key to sustenance. By further drilling down the lows and highs of this chart, one can factor in the disturbances. In the age of e-commerce, a smart promotional game plan involving a proportionate mix of social media drives and traditional methods is needed. Social Media drives typically encompass brand ambassadors from the local community of the retailer. These influencers are given a multi-dimensional insight into the product apart. They lure the community into visiting the store by talking about their experience. Picking the right influencer can be done by combining all the popular social media platforms to check metrics like reach, visitor count, page views, shares, like etc. The conventional methods of increasing footfalls are slightly tricky and might bite in on the profitability if not done without proper background research. Holding experience sessions or conducting events, investing in employee training, offering discounts include few proven methods. Investing in a tool or a system to track the effect of promotional drive by measuring online and offline reach is sensible in order to footfalls and consequently the sales volume.
Weather and Purchase method
One factor which small and mid-scale retailers largely tend to overlook in terms of significance is the weather. Changes in season and weather pattern have found to have been linked largely with willingness to spend and purchasing decisions. The simplest example would of that of the clothing sector. The onset of a harsh winter would lead to increase in thermal clothes, while this type of clothing would not sell in summer. A hot and humid or a rainy weather would prompt a customer to order non-essentials online. With the foray of groceries and other day to day essentials into the online market, consumers might prefer satiating their needs with just a few clicks instead of braving the climate and stepping out to shop. Statistics show a 12% increase in online traffic during wet or cold days as far as Home, clothing and furniture domains are concerned. Weather conditions impact different verticals in a different manner. There is no single apt formula to factor in weather fluctuations in sales strategies. Interestingly, a study by Kyle B.Murray has linked the mood of customer to purchase with that of weather patterns. The study also gave an insight into the type of goods that would sell depending on the weather. For example, customers were willing to pay 37% more for a green type upon exposure to sunlight.
Analysis and Game Plan – One Product, One store per day
To accommodate various factors affecting sales, leveraging technology to analyze POS (Point Of Sales) data is the need of the hour. Utilizing past sales data for making allowances and setting a cushion is logically the first step. Based on sales trend, the next step would be break down the sales plan to one product or a store per factoring in appropriate increase or decrease. Inventory planning, Staff planning and discount planning can is also needed to be done using the analysis from the POS data. Discount planning can be done in two ways – Promotional discount and clearance discount. Again, it is crucial to balance out so that it doesn’t bite into the profit margin. Employing various scientific principles can help achieve a balanced strategy. A study on property of fluctuations by Gaku Fukunaga, Hideki Takayasu, and Misako Takayasu conclude that fluctuations in the number of customer are bigger than fluctuation of sales quantities. It was also found that this inference varies when the purchase in question is voluminous in nature. Thus, the fundamental metric needed to be tracked to manage sales fluctuation is the number of customers. This is exactly where good analytics come in play. Sensible, suitable and scientific inferences from various data sources, at the end of the day are the secret to cracking the customer count and sales puzzle.
You can do customer conversion analysis using Bizstats cloud by asking your questions. If you are not tried Bizstats yet, you can try our demo now !