Why sales prediction is inaccurate?
The outlier in sales value that is abnormally high or low compared to the values in the sales time series. They can lead to inaccurate forecasts, we have to build a system that can automatically detect outliers and ignore them during forecast calculation.
Advantages of outliers analysis
- Improve data accuracy.
- Identify trends quickly.
- Build alerts only on important changes in data.
- Uncover the true causes of increases and decreases in data patterns.
Outliers in daily sales
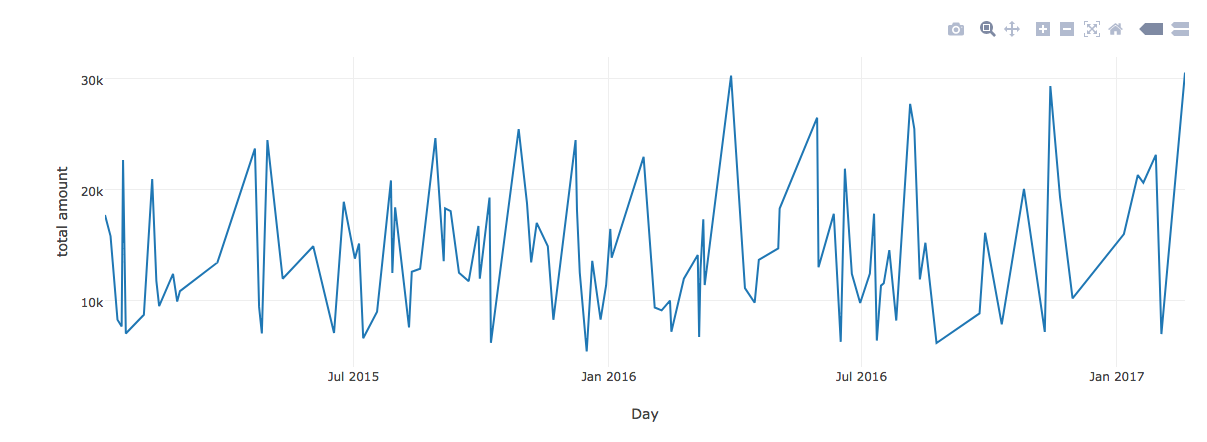
Understand daily sales data
The chart below represents daily sales of a retails company that sells technological products to various customers around the USA.
Basic Statistics of the data points
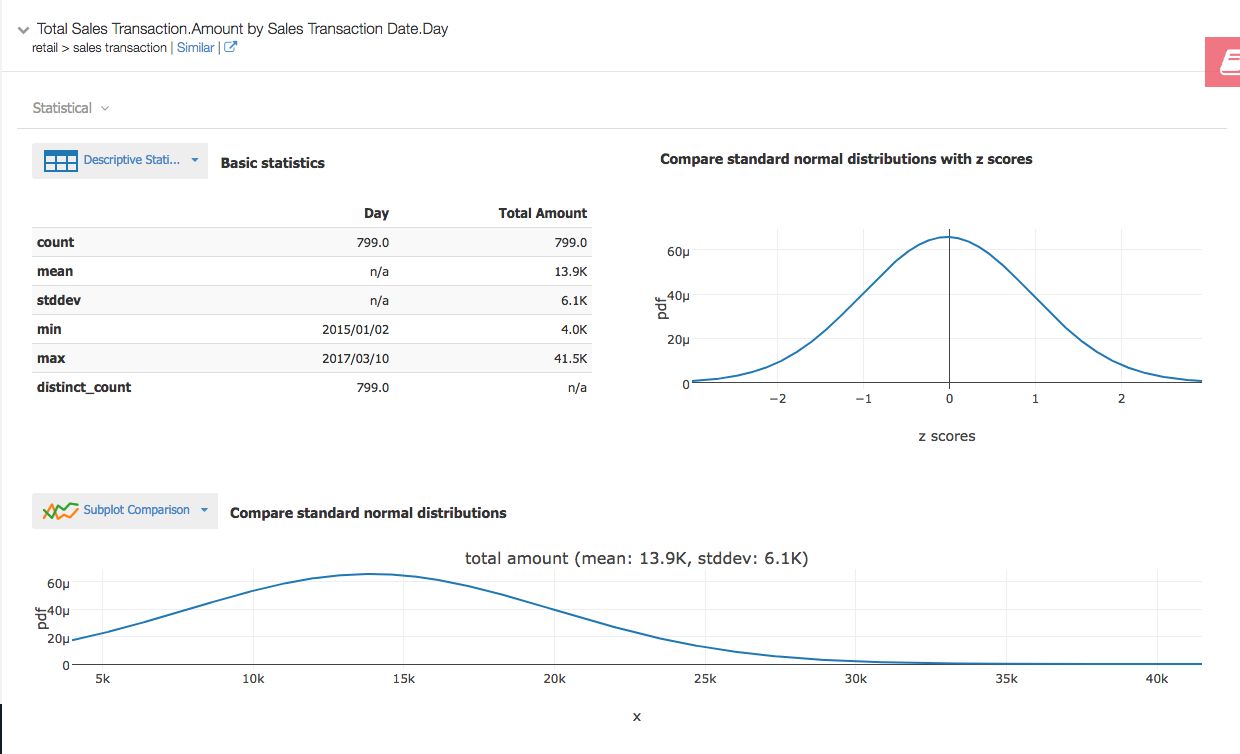
Sales prediction using actual data
From historical data, mean of daily sales total amount is 13.9k ($ 13900/-). From standard normal distribution, some of the daily sales amount up to $40K ($ 40000).
Hard to identify outliers data using time series data
Detect outliers in daily sales data, using IQR formula technique
If data falls more than 1.5IQR above the upper quartile or below the lower quartile. first quartile (Q1), third quartile (Q3) and the interquartile range (IQR=Q3-Q1). CO2 missions example: Q1=0.9, Q3=6.05, IQR=5.15. Compute Q1–1.5 × IQR (=–6.825) Compute Q3+1.5 × IQR (=13.775) Anything outside this range is an outlier. 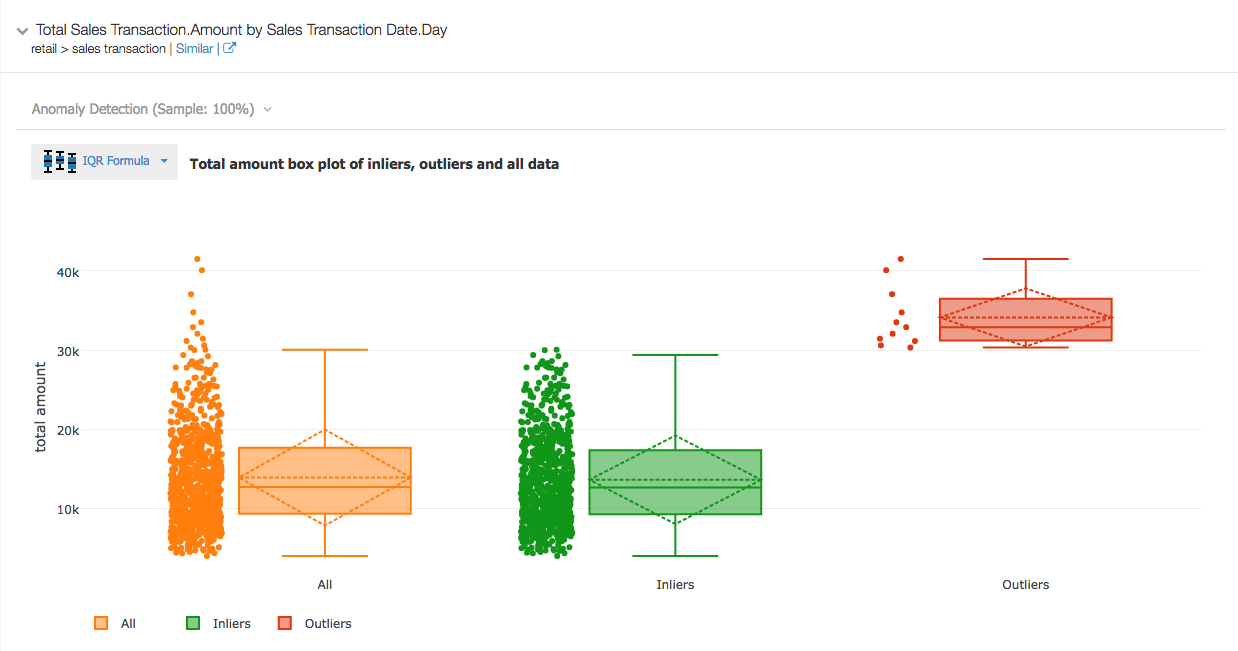
Prediction of daily sales after removing outliers data
Daily sales Prediction sales amount in $
with Outliers ( Actual data) 13.9k (13,900/-)
After removing outliers 13.3K (13,300/-)
Outliers in monthly sales
Descriptive statistics
The chart below represents monthly sales of a retails company. From standard normal distribution some of monthly sales amount below $200K ($ 200000). 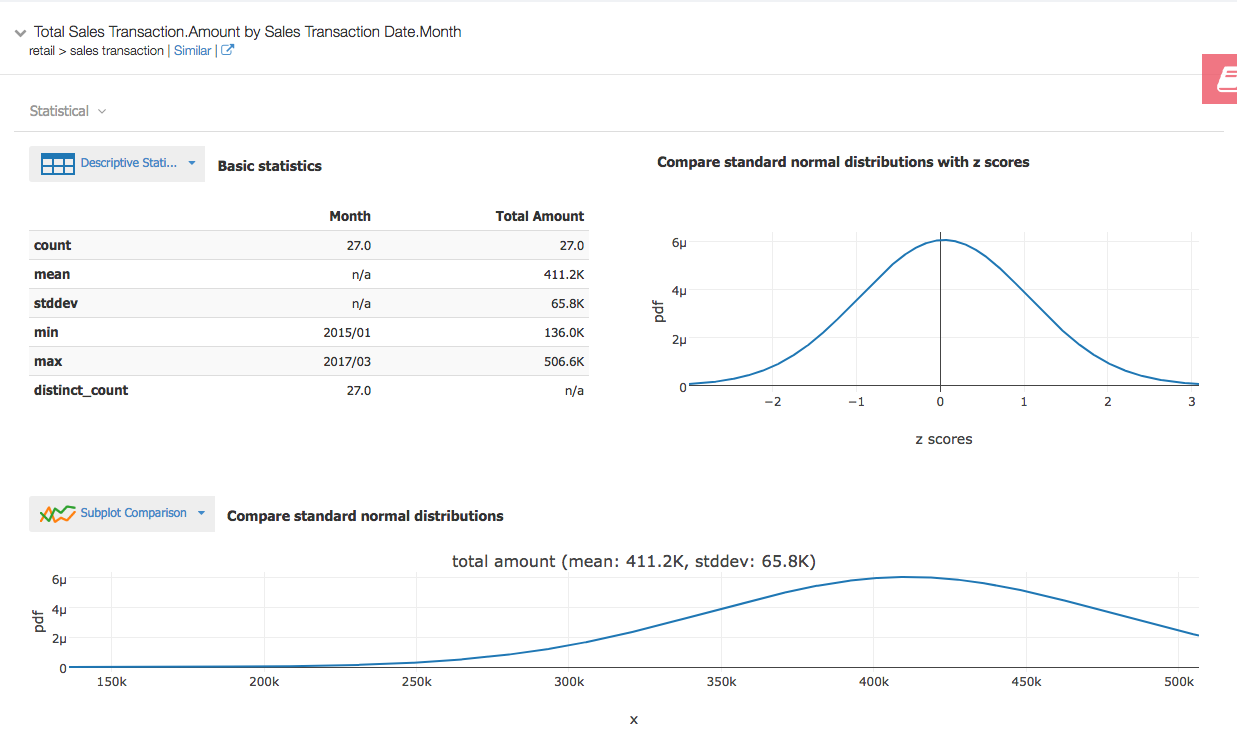
Sales prediction using actual data
From simple prediction model, we can predict monthly sales as mean of monthly sales total amount is 411.2k ($ 411,200/-).
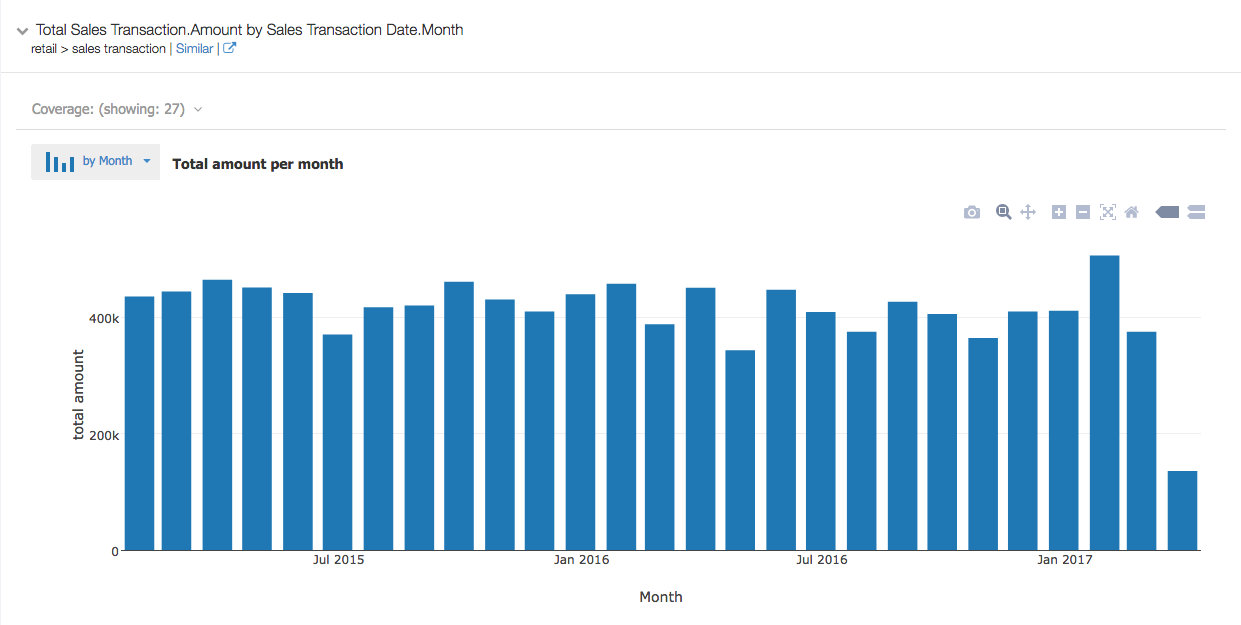
Outliers not visible in monthly time series sales data
Identify the outliers using IQR formula technique
Here we can see one of the monthly sales amounts is $ 136,039/- this data is from running month, not a completed month. this data is detected as the outlier. while predicting monthly sale removal of outliers data will give more accuracy. 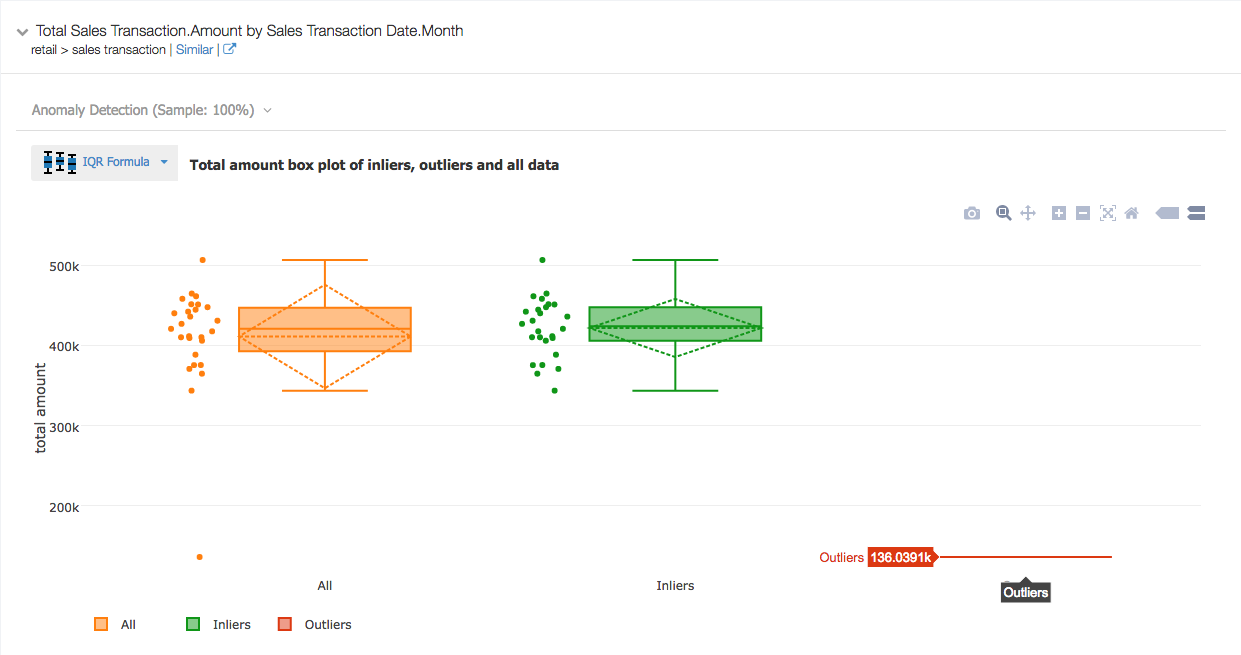
Prediction of monthly sales after removing outliers
Monthly sales prediction Sales amount in $
With outliers ( Actual data) 411.2k (411,200/-)
After removing outliers 421.8K (421,783/-)
Conclusion
As you see, quickly increase the accuracy of sales prediction using simple outliers IQR technique there are more complex outliers detection algorithms with multiple measures and attributes. Here we used the IQR technique to find out the outliers. using same, how to build a prediction of an individual product sales in Part 2 of this article we going discuss as follows:
- Understand monthly sales data for a product
- Generally, outliers are not visible in time series data
- Detection of outliers
- Comparing sales prediction before and after of outlier removal. Read Part 2 here
You can do more complex analysis using Bizstats cloud by asking your questions. If you are not tried Bizstats yet, you can try our demo now!